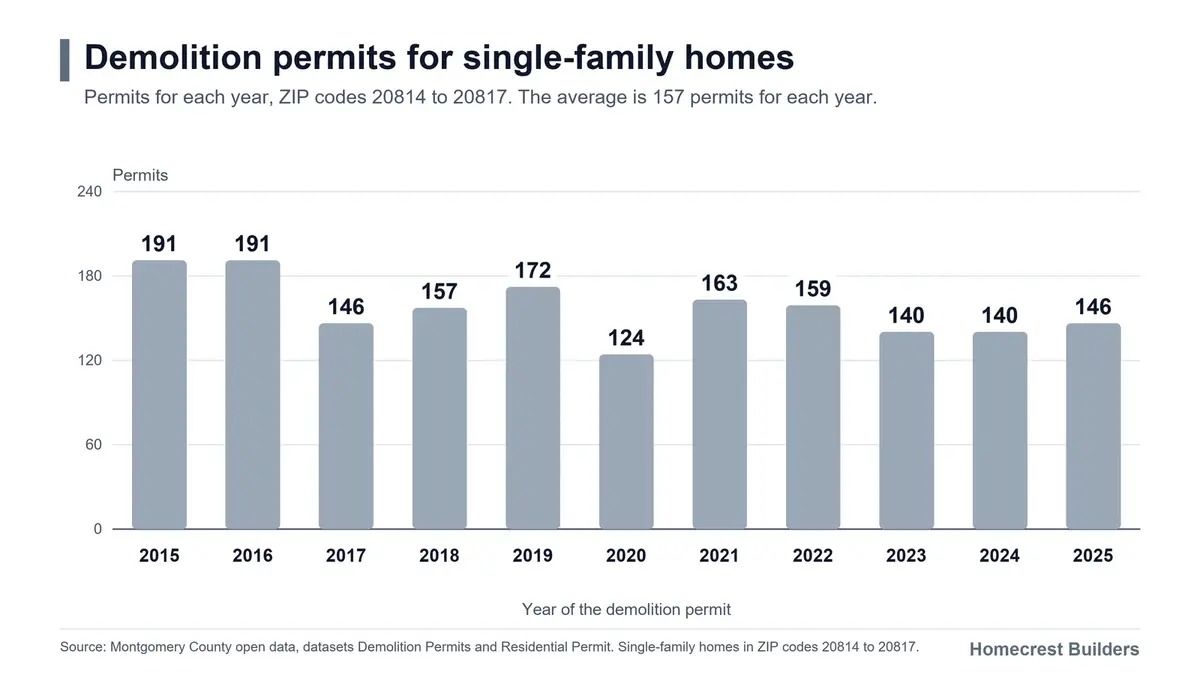
Summary: The county gave 1,729 demolition permits for single-family homes in the ZIP codes 20814, 20815, 20816 and 20817. These ZIP codes include Bethesda and Chevy Chase. The permits are from 2015 to 2025. The number for each year is from 124 to 191. The average is 157 permits for each year.
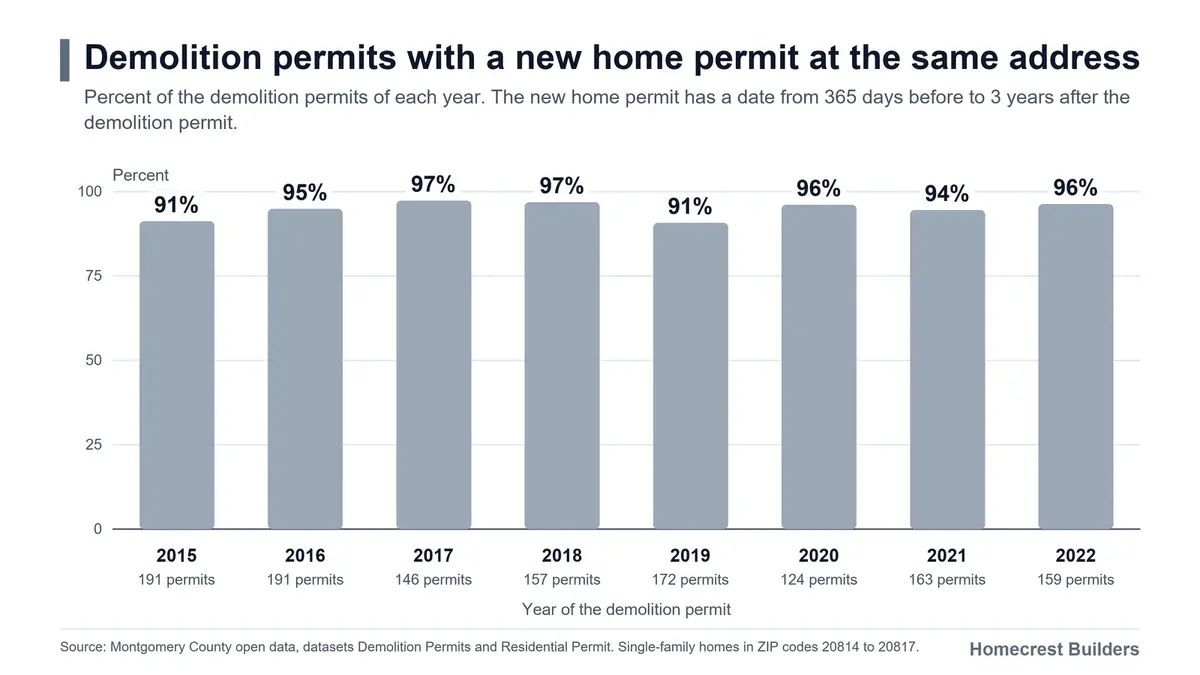
We examined the data for a new home permit at the same address. For the 1,303 demolition permits from 2015 to 2022, 94 percent have a new home permit at the same address. The address in a new home permit can be different from the address in the demolition permit. Thus, the share can be higher. For 1,183 of these permits, the data has the date of the final inspection of the new home. For these permits, the median time from the demolition permit to the final inspection is 315 days.
How we read the data
Montgomery County shows the data of its demolition permits and of its residential permits on its open data website. The county updates the data each day. Each row of the data is one permit. The row has the date when the county gave the permit. The county data shows that the demolition can start from this date.
We selected the demolition permits for a single-family home in the ZIP codes 20814 to 20817. We selected the permits that the county gave from 2015 to 2025. We used full years only. We did not use 164 permits for other types of structure. A demolition permit is one row of the data. The number of permits is not the number of projects.
A new home permit is a residential permit with the work type "CONSTRUCT" for a single-family home. For each demolition permit, we found the new home permit at the same address, if the data has one. We used the address of the permit in the two datasets. The new home permit must have a date from 365 days before to 3 years after the date of the demolition permit. If more than one permit is in this period, we used the first one. This page does not show an address.
The data has 3 years or more after each demolition permit from 2015 to 2022. Thus, the parts of this page about the new home permit of a demolition permit use only these 1,303 permits.
The time on this page is the number of days between two dates. The first date is the date of the demolition permit. The second date is the date of the new home permit or of the final inspection of the new home. A time of less than 0 days shows that the new home permit has a date before the demolition permit.
At the final inspection, the construction is completed and an inspector of the Department of Permitting Services (DPS) gives approval. DPS is a department of Montgomery County.
Demolition permits for each year and each ZIP code
| Year of the permit | Demolition permits |
|---|---|
| 2015 | 191 |
| 2016 | 191 |
| 2017 | 146 |
| 2018 | 157 |
| 2019 | 172 |
| 2020 | 124 |
| 2021 | 163 |
| 2022 | 159 |
| 2023 | 140 |
| 2024 | 140 |
| 2025 | 146 |
The number of permits is highest in 2015 and 2016, with 191 permits in each year. The number is lowest in 2020, with 124 permits. The data does not show the cause of the difference between the years.
| ZIP code | Demolition permits | Share of all permits |
|---|---|---|
| 20814 | 443 | 26 percent |
| 20815 | 227 | 13 percent |
| 20816 | 179 | 10 percent |
| 20817 | 880 | 51 percent |
The ZIP code 20817 has 51 percent of the permits. The data does not show the number of homes in each ZIP code. Thus, the table does not show which ZIP code has the highest share of its homes with a demolition permit.
Demolition permits with a new home permit at the same address
This part uses the 1,303 demolition permits from 2015 to 2022. For 1,231 of these permits, the data has a new home permit at the same address. The share is 94 percent. The other 72 permits have no new home permit at the same address in the period that we used.
| Year of the demolition permit | Demolition permits | With a new home permit | Share |
|---|---|---|---|
| 2015 | 191 | 174 | 91 percent |
| 2016 | 191 | 181 | 95 percent |
| 2017 | 146 | 142 | 97 percent |
| 2018 | 157 | 152 | 97 percent |
| 2019 | 172 | 156 | 91 percent |
| 2020 | 124 | 119 | 96 percent |
| 2021 | 163 | 154 | 94 percent |
| 2022 | 159 | 153 | 96 percent |
The share is from 91 to 97 percent for the years.
We compared the address in the two datasets. A new home with a different address in the new home permit is not in these numbers. Thus, the share can be higher than the share on this page.
3 new home permits have two demolition permits at the same address. Thus, the number of demolition permits with a new home permit is not the number of new homes.
The time from the demolition permit to the new home permit
For 1,231 demolition permits, the data has the two dates. For 75 percent of these permits, the time between the two dates is 11 days or less.
| Share of the 1,231 demolition permits | Time from the demolition permit to the new home permit |
|---|---|
| 25 percent of the permits | not more than 0 days |
| 50 percent of the permits (the median) | not more than 1 day |
| 75 percent of the permits | not more than 11 days |
For 45 percent of the permits, the new home permit has the same date as the demolition permit or a date before it. For 25 permits, the new home permit has a date before the demolition permit. The share is 2 percent. The data does not show the cause of the sequence of the permits.
For 95 percent of the permits, the time is 90 days or less. For 99 percent of the permits, the time is 365 days or less.
The time from the demolition permit to the final inspection of the new home
For 1,183 of the 1,231 demolition permits, the data has the date of the final inspection of the new home. The share is 96 percent. The table gives the time for these permits. The time starts at the date of the demolition permit.
| Share of the 1,183 permits with a final inspection | Time from the demolition permit to the final inspection |
|---|---|
| 25 percent of the permits | not more than 249 days |
| 50 percent of the permits (the median) | not more than 315 days |
| 75 percent of the permits | not more than 427 days |
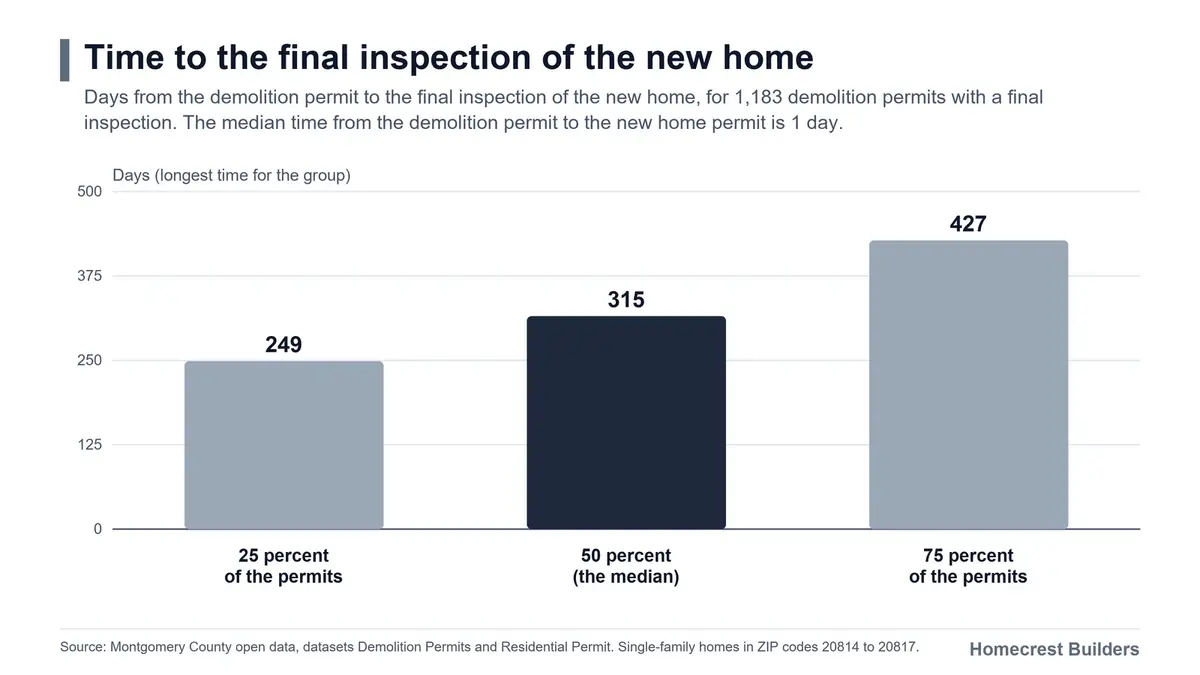
The median is approximately 10 months. The time starts when the demolition can start, and it stops at the final inspection of the new home. The time can also include days with no work. The data does not show these days.
The other permits have no date of the final inspection. Thus, the times in this table can be shorter than the times for all permits. The data does not show the cause.
The declared cost and the floor area of the new homes
The applicant gives the declared cost and the floor area to the county in the application. The declared cost is the cost that the applicant gives. It is not the cost in a contract. The floor area is the area of the full building in square feet (SF). It is the area that the applicant gives.
| Share of the permits | Declared cost | Floor area |
|---|---|---|
| 25 percent of the permits | not more than USD 350,000 | not more than 5,320 SF |
| 50 percent of the permits (the median) | not more than USD 500,000 | not more than 6,262 SF |
| 75 percent of the permits | not more than USD 650,000 | not more than 7,508 SF |
The table uses 1,223 permits for the declared cost and 1,231 permits for the floor area. The table uses a declared cost of USD 1,000 or more and a floor area of 500 SF or more. For the other 8 permits, the data has no declared cost of USD 1,000 or more. The declared cost of a new home can be different from the cost in a contract. The cost in a contract can be higher or lower.
New home permits with a demolition permit at the same address
We also started from the new home permits. The data has 1,261 new home permits from 2018 to 2024. For 994 of these permits, the data has a demolition permit at the same address. The share is 79 percent. The new home permit must have a date from 365 days before to 3 years after the date of the demolition permit.
For the other new home permits, the data has no demolition permit at the same address. The data does not show the cause. The address can also be different in the two datasets.
We used the 1,259 permits with a declared cost of USD 1,000 or more. The median declared cost is USD 500,000. We used the 1,256 permits with a floor area of 500 SF or more. The median floor area is 6,395 SF.
The work description of the demolition permits
A demolition permit can have a work description. For 793 of the 1,729 demolition permits, the data has a work description. The share is 46 percent.
We examined the work descriptions for the words "REBUILD", "NEW" and "BUILD". We selected these words. The county does not use these words to put the permits in groups. We found one or more of these words in 549 of the 793 work descriptions. The share is 69 percent.
For the demolition permits from 2015 to 2022, 525 work descriptions contain one or more of these words. For 505 of these permits, the data has a new home permit at the same address. The share is 96 percent.
Information that these numbers do not give
The numbers do not give this information:
- The cause of a demolition
- The cost of a project, because the declared cost is not a cost in a contract
- The time before the demolition permit
- A new home with a different address in the two datasets
- A home that is not in the ZIP codes 20814 to 20817
A project can have more than one permit. The number of permits is not the number of projects.
The numbers for the words in the work descriptions only show words. They do not show the work. Only 46 percent of the permits have a work description.
The data has no item that shows if a demolition removes the full home.
Information for an owner of a large project
The data has 1,231 demolition permits from 2015 to 2022 with a new home permit at the same address. For 75 percent of them, the new home permit has a date not more than 11 days after the demolition permit. The new home permit can also have a date before the demolition permit. For the 1,183 permits with a final inspection, the median time from the demolition permit to this inspection is 315 days. For 25 percent of these permits, the time is 427 days or more.
The numbers on this page do not give the time before the demolition permit. A median does not show the time of your project. The time of your project can be different. The declared cost in the data is not the cost of your project. You can tell your contractor to give you a cost in a contract and a plan with dates for the work.
Questions and answers
Is the number of demolition permits the same each year?
No. The county gave from 124 to 191 demolition permits each year for single-family homes in the four ZIP codes. The average is 157 permits for each year.
Does each demolition permit have a new home permit at the same address?
No. For the permits from 2015 to 2022, 94 percent have a new home permit at the same address. A new home permit with a different address is not in these numbers. Thus, the share can be higher.
Is the new home permit before or after the demolition permit?
The data has 1,231 demolition permits from 2015 to 2022 with a new home permit at the same address. For these permits, the median time between the two permits is 1 day. For 45 percent of these permits, the new home permit has the same date as the demolition permit or a date before it. The data does not show the cause of the sequence.
Is the declared cost the cost in a contract?
No. The declared cost is the cost that the applicant gives to the county. The cost in a contract can be higher or lower.
Does the data show the cause of a demolition?
No. The data has no item for the cause of a demolition. The data shows the dates, the address and the work description of the permit. Only 46 percent of the permits have a work description.
Do you want a large project in Bethesda or Chevy Chase?
We can help you to schedule the work of your project. Request a Consultation.
You can also read: The Time for an Addition Permit in Bethesda and Chevy Chase
You can also read: The Declared Cost of a Home Addition in Bethesda and Chevy Chase
You can also read: The Time From the Permit to the Final Inspection for an Addition in Bethesda and Chevy Chase
Sources
- The sources of the data are the datasets "Demolition Permits" (data.montgomerycountymd.gov) and "Residential Permit" (data.montgomerycountymd.gov) of the open data of Montgomery County.
- The demolition permits are for single-family homes in the ZIP codes 20814 to 20817. The permits are from 2015 to 2025.
- The new home permits are the residential permits with the work type "CONSTRUCT" for single-family homes in the same ZIP codes.
- We used a script to calculate the numbers from the county data.
Stay in the loop
Get updates on our newest remodeling and construction projects — no spam, just great work.