Summary: The data that we selected has 1,989 permits for home additions in the ZIP codes 20814, 20815, 20816 and 20817. These ZIP codes include Bethesda and Chevy Chase. The county gave each permit from 2019 to 2025. For 1,571 of the permits, the data shows a final inspection with the result "PASSED". For these permits, the median time from the permit to the final inspection is 231 days. The median is the middle value of the times.
The other permits have no time on this page. Thus, the median for all permits can be longer.
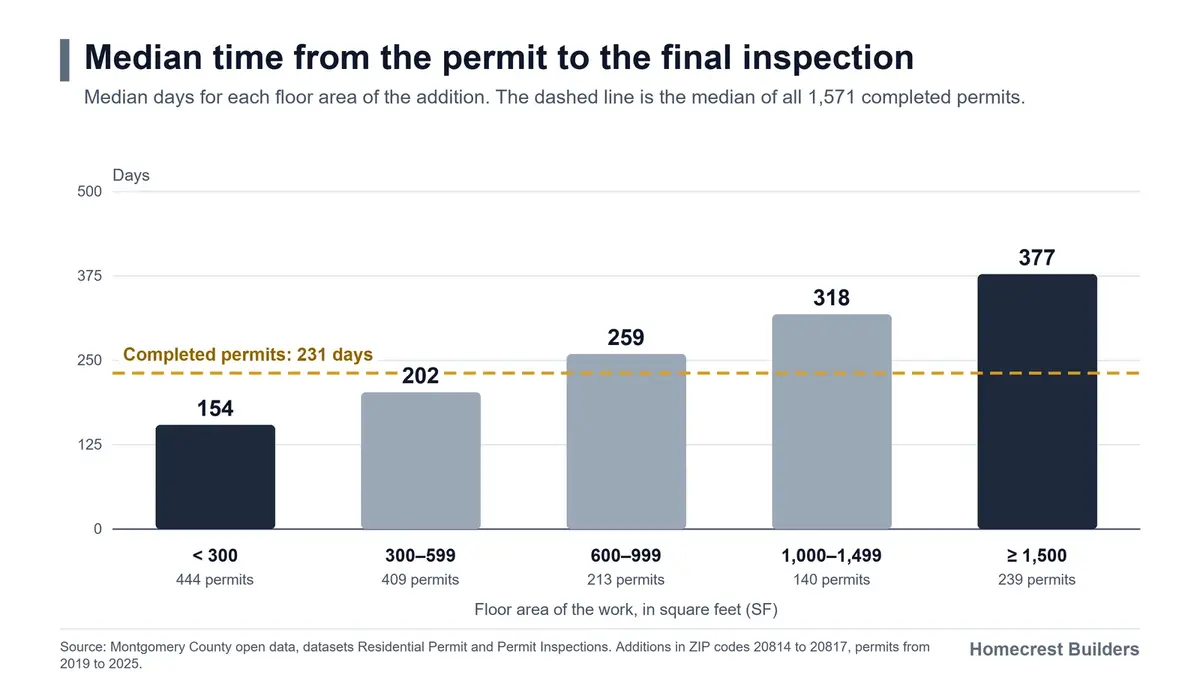
The median time is longer for a larger addition. The median time is 154 days for an addition of less than 300 square feet (SF). The median time is 377 days for an addition of 1,500 SF or more.
How we read the data
Montgomery County shows the data of its residential permits and of its inspections on its open data website. Each row of the permit data is one permit. The row has the date when the county gave the permit. The row also has the work type and the floor area of the work in square feet. The applicant gives the floor area in the application.
The inspection data has one row for each inspection of a permit. Each row has the type of the inspection, the result and the date of the inspection.
We selected the permits that have the work type "ADD" (addition) and are for single-family homes. We selected the permits that the county gave from 2019 to 2025. We used full years only.
The time on this page is the number of days between two dates. The first date is the date of the permit. The second date is the date of the first final inspection with the result "PASSED".
The county data shows that the work can start from the date of the permit. An inspector of the Department of Permitting Services (DPS) does the final inspection. DPS is a department of Montgomery County.
Only a permit with a final inspection with the result "PASSED" has this time. On this page, these permits are "completed permits". A permit with no inspection of this type in the data has no time on this page.
The time from the permit to the final inspection
The table that follows gives the longest time for 25, 50, 75 and 90 percent of the 1,571 completed permits.
| Completed permits | Time from the permit to the final inspection |
|---|---|
| 25 percent of the permits | not more than 136 days |
| 50 percent of the permits (the median) | not more than 231 days |
| 75 percent of the permits | not more than 348 days |
| 90 percent of the permits | not more than 497 days |
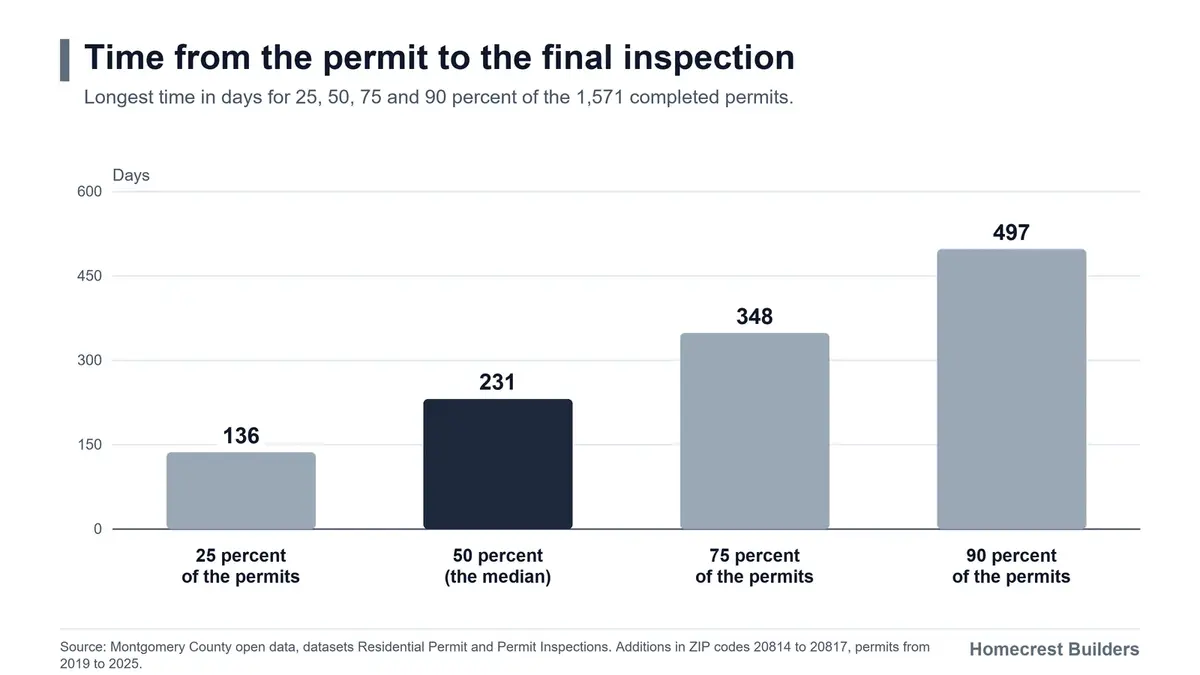
The time is the number of days from the date of the permit to the date of the final inspection. The time can include days with no work. The data does not show these days.
Permits with no final inspection
The data that we selected has 1,989 permits. For 1,571 of these permits, the data shows a final inspection with the result "PASSED". The other permits have no inspection of this type in the data. The data does not show the cause for these permits.
The permit data gives the status "Finaled" to 1,602 permits. For 118 of these permits, the inspection data has no final inspection with the result "PASSED". Thus, the two sets of data are different for some permits. The completed permits on this page are the permits that have an inspection of this type in the inspection data.
A permit with a date near the end of the data has less time to finish. Thus, we also examined the 1,221 permits that the county gave from 2019 to 2022. For these permits, the data has 3 years or more after the date of the permit. The table that follows gives the percent of these 1,221 permits that are completed permits after a time.
| Time from the permit | Share of the 1,221 permits that are completed permits |
|---|---|
| In 1 year or less | 60 percent |
| In 1.5 years or less | 73 percent |
| In 2 years or less | 77 percent |
| In 3 years or less | 80 percent |
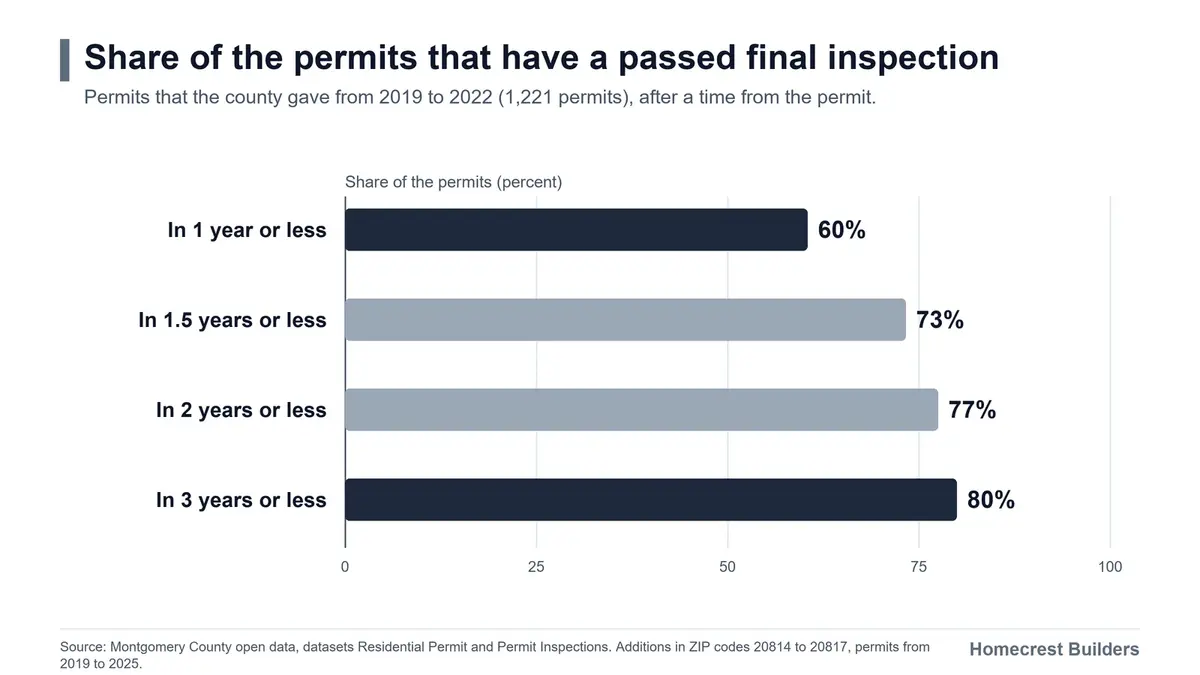
In total, 81 percent of the 1,221 permits are completed permits. For the other 19 percent, the data shows no final inspection with the result "PASSED". The data does not give the cause. These permits are not in the median times on this page.
The time for additions of different floor areas
The median time is different for additions of different floor areas. The table that follows gives the median time. Each row has only the completed permits of the group.
| Floor area of the work | Permits | Completed permits | Median time |
|---|---|---|---|
| Less than 300 SF | 530 | 444 | 154 days |
| 300 to 599 SF | 497 | 409 | 202 days |
| 600 to 999 SF | 282 | 213 | 259 days |
| 1,000 to 1,499 SF | 193 | 140 | 318 days |
| 1,500 SF or more | 326 | 239 | 377 days |
In the table, the median time is longer for a larger floor area. For 10 percent of the completed permits for additions of 1,500 SF or more, the time was 699 days or more. This table has only the permits that have a floor area of 100 SF or more in the data. The table does not have 161 permits. These permits are in the other tables.
The time for each year and each ZIP code
The table that follows gives the median time for each year of the permit.
| Year of the permit | Permits | Completed permits | Share of the permits | Median time |
|---|---|---|---|---|
| 2019 | 302 | 245 | 81 percent | 219 days |
| 2020 | 276 | 210 | 76 percent | 218 days |
| 2021 | 337 | 278 | 82 percent | 257 days |
| 2022 | 306 | 253 | 83 percent | 275 days |
| 2023 | 289 | 225 | 78 percent | 216 days |
| 2024 | 241 | 198 | 82 percent | 249 days |
| 2025 | 238 | 162 | 68 percent | 190 days |
In the table, each year has only the completed permits. The share of completed permits is lower for 2025 than for the other years. Thus, the median time for 2025 can be too short. The data does not show the cause of the difference between the years.
The table that follows gives the median time for each ZIP code.
| ZIP code | Completed permits | Median time |
|---|---|---|
| 20814 | 260 | 213 days |
| 20815 | 443 | 255 days |
| 20816 | 337 | 253 days |
| 20817 | 531 | 208 days |
The median time is from 208 to 255 days for the ZIP codes. For the floor areas of the additions, the median time is from 154 to 377 days. The difference between the median times is larger for the floor areas than for the ZIP codes. We compare groups. The data does not show the cause.
A check of the dates
The permit data has the date "final date". This date is the date when the construction is completed and DPS gives approval. We compared this date with the date of the first final inspection with the result "PASSED" in the inspection data. For 1,484 permits, the data has the two dates. For 97 percent of these permits, the two dates are not more than 30 days apart.
Information that these numbers do not give
The numbers do not give this information:
- The time before the permit
- The time for work that is not an addition, for example a new home
- The time for a permit that is not in the county data
- The cost of the work
- The cause of a long time
A project can have more than one permit. The number of permits is not the number of projects. The county data does not show the plans of the owner, the contractor or the weather.
Information for an owner of a large project
For a large addition, the time between the permit and the final inspection is longer than for a small addition. In the data, the median time is 377 days for the completed permits for additions of 1,500 SF or more. For 10 percent of these completed permits, the time is 699 days or more. 73 percent of all permits of this floor area are completed permits. For the permits from 2019 to 2022, the share is 82 percent. Thus, the times for all permits can be longer.
A median does not show the time of your project. The time of your project can be different.
You can tell your contractor to give the date of each inspection.
Questions and answers
The median time from the permit to the final inspection
For the completed permits of the data that we selected, the median time is 231 days. The permits with no final inspection with the result "PASSED" are not in this median. The median for all permits can be longer. For 25 percent of the completed permits, the time was 136 days or less. For 25 percent, the time was 348 days or more.
Is the time shorter for a small addition than for a large addition?
Yes. For the completed permits, the median time is 154 days for an addition of less than 300 SF. The median time is 377 days for an addition of 1,500 SF or more.
Does each permit have a final inspection with the result "PASSED"?
No. For 81 percent of the permits that the county gave from 2019 to 2022, the data shows an inspection of this type. The data does not give the cause for the other permits.
Does the time include the time to get the permit?
No. The time starts with the permit. The page on the permit time gives the time before the permit.
Do you want an addition in Bethesda or Chevy Chase?
We can help you to schedule the work of your project. Request a Consultation.
You can also read: The Time for an Addition Permit in Bethesda and Chevy Chase
Sources
- The sources of the data are the datasets "Residential Permit" (data.montgomerycountymd.gov) and "Permit Inspections" (data.montgomerycountymd.gov) of the open data of Montgomery County.
- The data is for the permits with the work type "ADD" (addition) and for single-family homes in the ZIP codes 20814 to 20817. The permits are from 2019 to 2025.
- The inspections are the inspections of the type "FINAL" with the result "PASSED".
- We used a script to calculate the numbers from the county data.
Stay in the loop
Get updates on our newest remodeling and construction projects — no spam, just great work.